

 EDITORS' CHOICE
 Graphy
EDITORS' CHOICECreate professional-level graphs that drive decisions and inspire actions.
Try Graphy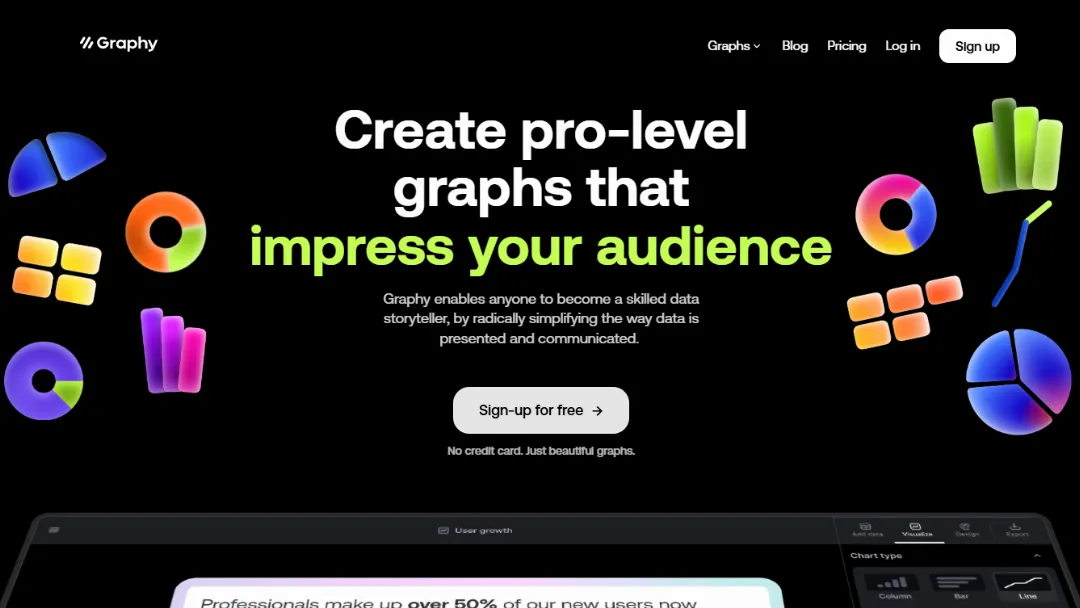
What is Graphy?
Try GraphyGraphy is an intuitive data visualization tool that transforms complex data into beautiful, actionable graphs. It simplifies the process of data storytelling, enabling users to present insights clearly and effectively.
With features powered by AI, Graphy allows for quick graph creation and insightful analysis, making it accessible for individuals and teams looking to enhance their data communication.
Features:
- AI-Generated Insights: Automatically creates charts and explains key insights from your data.
- Multiple Graph Types: Supports various graph formats, including bar graphs, pie charts, heatmaps, and funnels.
- Light/Dark Mode: Offers a visually appealing interface that can switch between light and dark themes.
- Google Sheets Integration: Easily connect and import data directly from Google Sheets.
- Interactive Sharing: Share graphs as interactive links, embeds, or images across platforms.
- Visual Annotations: Add visual annotations and enhancements like goals and trend lines to graphs.
Published on Feb. 1, 2025