Submit New ProductIf accepted, you'll receive a payment link and upon purchase your product will go live instantly.By submitting, you agree to our Terms of Service and Privacy Policy.
Submit
AboutWebCurate is a place to discover the best online products and tools, all hand-curated and organized in one place.
Hossein Yazdi
As someone who loves building online things, I've spent years exploring the web and finding amazing tools that make things easier and faster. With so much out there, it can be hard to know where to start.That's why I created WebCurate. Here, you'll find the best online products and tools I've come across, all in one place. I hope it helps make your online projects easier and more fun!
Advertise Put your product in the spotlight on our platform and reach more people who need your product.Opportunities1. Main Page Banner ($99/ 30 Days) Available2. Main Header Featuring ($119/ 30 Days) AvailablePlease reach out for more information and booking.
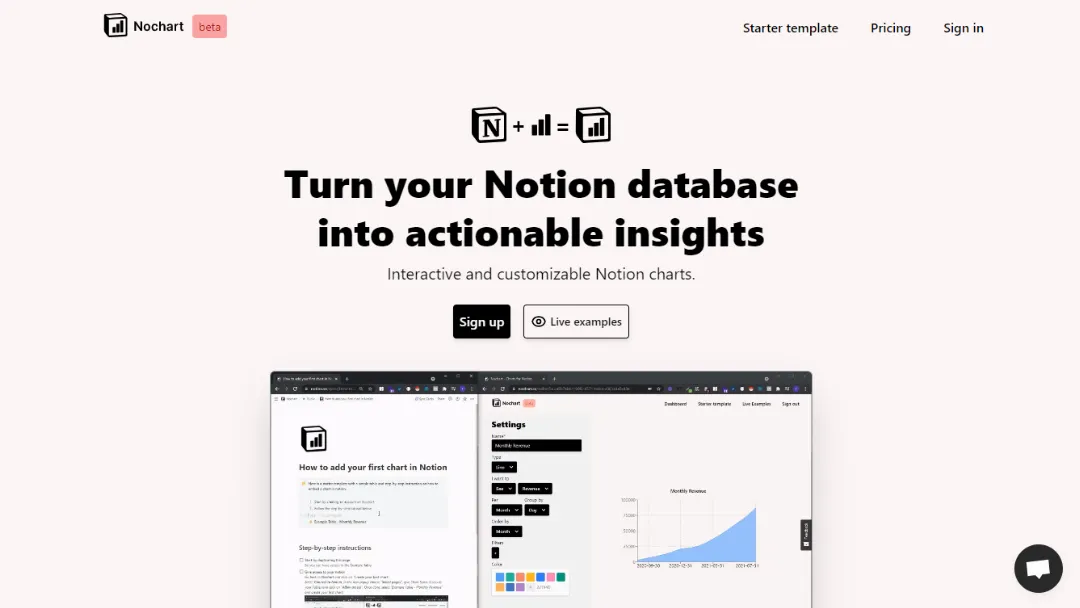
Nochart is a platform that allows users to create interactive and customizable charts for their Notion databases. It provides AI-powered functionality to help users visualize and analyze data within Notion.
Features:
Interactive Charts: Create dynamic and interactive charts that can be embedded in Notion pages.
Customization Options: Customize the appearance and style of charts to match your branding or design preferences.
AI-Powered Chart Creation: Utilize AI algorithms to automatically generate chart visualizations based on user input.
Template Library: Access a library of pre-designed chart templates to jumpstart your data visualization process.
Embedding Capabilities: Easily embed charts into both public and private Notion pages with a single click.
Use Cases:
Data Analysis: Visualize and analyze data within your Notion databases to gain insights and make informed decisions.
Project Management: Track and display project progress, milestones, and key performance indicators using customizable charts.
Sales and CRM: Create visual representations of sales data, customer metrics, and pipeline management for effective sales tracking.
Financial Tracking: Monitor and visualize budgeting, expense tracking, and financial performance using dynamic charts.
Reading Lists and Collections: Organize and visualize reading lists, book recommendations, and content collections using interactive charts.